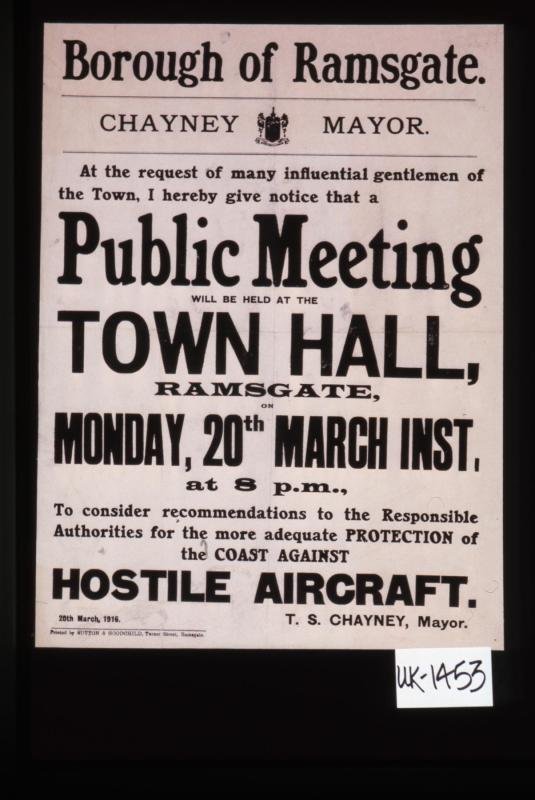
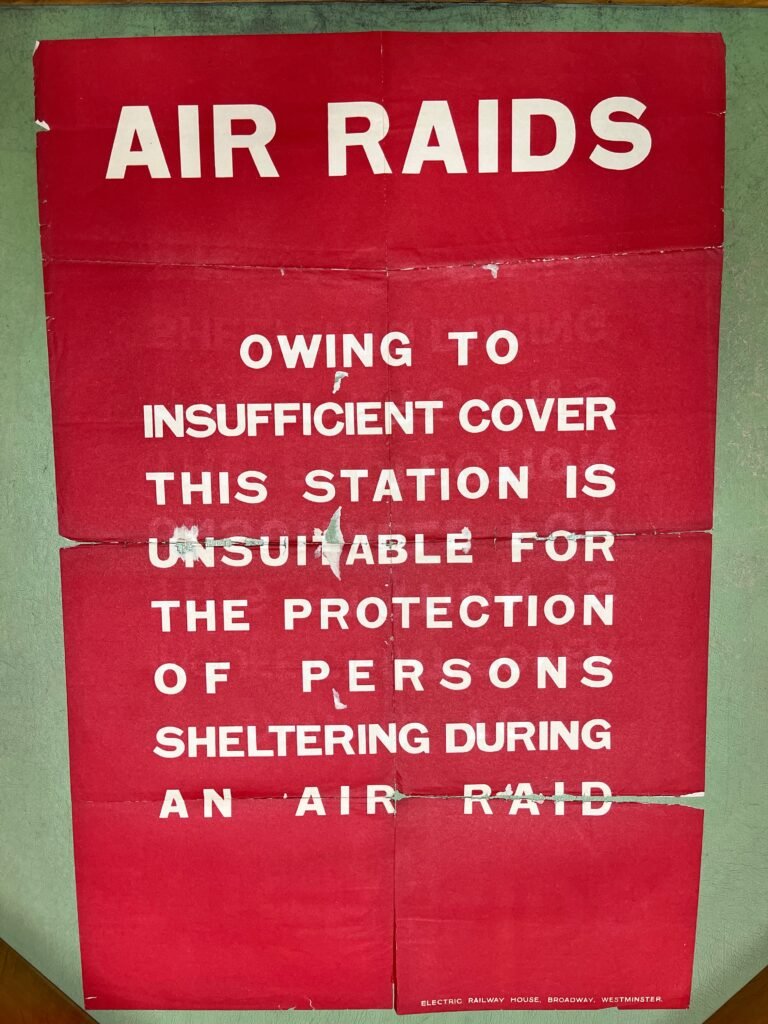
Nearly four years ago, I wrote a post about a software project Tim Sherratt and I were working on for Heritage of the Air called hota-time. Briefly, the idea was that hota-time would extract and then plot travel times between London and Sydney mentioned in Trove Newspaper headlines, as a quantitative way to gauge the qualitative impact that aviation had on Australian perceptions of distance -- or, to be more precise, travel time. We (Tim) wrote the code, proved the concept to our satisfaction, uploaded the project, and then didn't get around to writing it up for publication. Which we are now remedying… nearly four years later! (The writing, that is, not yet the publication.)
As part of this process, we've been cleaning up the data and trying some different visualisations. Here's one of the more interesting plots.
![X-Y scatter plot, with X axis = Year (from 1880 to 1950s), Y axis = Days (travel time) between Sydney and London. Indigo data (sea travel, predicted travel times) dominates from about 1880s to 1915, between 20 and 30 days without much trend. Dark red data (sea travel, actual travel times) is not common, mostly sits around 30 days. Yellow (air travel, actual travel times) shows up in the 1930s, declining from around 15-22 to 5 or less by the late 1940s. By far the most common data is teal (air travel, predicted), which thickly clusters from 1917 onwards, starting at around 5-12 days and declining to well under 5 by the early 1950s](https://airminded.org/wp-content/uploads/2023/01/hota-time-london-sydney-imagined-real-all-20230109.png)
This is an updated version of the first plot in the old post, but instead of just lumping all the data together, it is separated out by colour:
- dark red: sea, present
- indigo: sea, future
- yellow: air, present
- teal: air, future
That is, present travel times are those reported as actually having been achieved, whereas future travel times have not yet been achieved (usually because they are medium or long-term forecasts, but shorter-term schedule changes fall into this category too). So dark red + yellow tracks actual travel times between London and Sydney, while indigo + teal tracks predicted travel times. Or dark red + indigo tracks sea travel, while yellow + teal tracks air travel.
...continue reading