

One thing we were curious to try with hota-time is to see whether the idea and the code could be applied beyond looking at London-Sydney travel times. And it can! Here is the output for Melbourne-Sydney travel times, in hours rather than days:
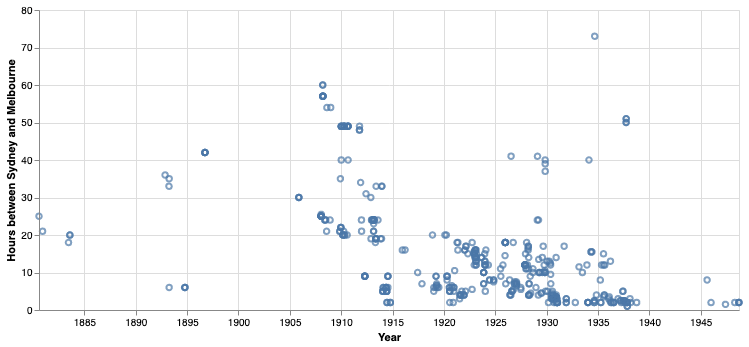
Lots of data points, roughly the same as for the London-Sydney plot. It does look like there is some sort of trend over time, but it’s pretty messy. So let’s break it down a bit so we can see what’s going on.
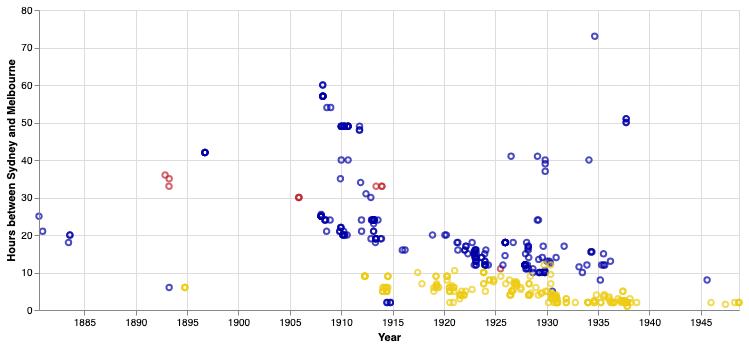
As with the previous post, this is colour-separated into domains:
- dark red: sea
- indigo: land
- yellow: air
Land is new here (obviously being not very applicable to London-Sydney travel), and also the distinction between present and future has been dropped (as there was less speculation and more action here, an interesting fact in itself).
So once again, there’s not much dark red – not much interest in the headlines about fast sea travel between Australia’s two biggest cities (at least none that matches our particular formula). And there is a gratifying amount of yellow, representing air travel (SYD-MEL regularly shows up in the world’s top 10 busiest air routes, so maybe this is not a surprise). From just before the First World War up until the Second, this is a near-constant presence, starting out around 10 hours and declining to 2 hours. (That early outlier in 1894 is none other than our old friend, N. R. Gordon.)
What was surprising, though, is how much indigo there is — obviously, land transport. This is a mixed category: trains, motor cars, motorcycles, bicycles, even horses and walking. We should perhaps subdivide this further, but collating this data already involves a fair bit of manual editing (which gets less feasible the bigger the data gets) and it’s informative as it is.
What interests me about the indigo data particularly is that while, yes, air travel between the two cities was nearly always faster in practice and in imagination than land travel (though do note the 2 hours predicted in 1914 for the Bachelet ‘Air Train’), it didn’t displace attempts to get between the two cities ever faster on land. Indeed, there still a healthy number of indigo data points during the 1920s and 1930s (aka the ‘golden age of aviation’). What’s more, it’s clear from the above plot that there was already a speed culture before aviation made an impact. This begins in our data quite abruptly in 1908 with an attempt to breach the 24-hour mark in a motor car (even as late as 1905 motor cars were taking 6 days to make the trip — albeit in stages, as it was a question of reliability more than speed); by 1935 this record was down to just under 9 hours. In fact, inspecting the data a bit more closely, there were already cycling record attempts by 1896, so the speed culture does go back a long way.
As for trends, again these are easier to see by plotting median values:

Again, sea travel is not really showing up, though at around 30-35 hours it is competitive with land travel into the early 20th century. Land travel declines from 20-25 hours in the pre-1914 period down to 10-15 hours by 1925, and then flattens out and even rises in the late 1930s (though this is mainly due to a burst of interest in cycling records). And air travel starts out at around 5-10 hours before the First World War, and is already down at the 2 hour mark as early as 1931. Flying time between Sydney and Melbourne is a touch under 1.5 hours even today — must be time for an SST?
![]() This work is licensed under a Creative Commons Attribution-NonCommercial-NoDerivatives 4.0 International License.
Permissions beyond the scope of this license may be available at http://airminded.org/copyright/.
This work is licensed under a Creative Commons Attribution-NonCommercial-NoDerivatives 4.0 International License.
Permissions beyond the scope of this license may be available at http://airminded.org/copyright/.


One of the interesting things here (in both posts) is the variance as well as the median – it looks like travel by sea, and later by air, was a whole lot more predictable than by land. And you know, that’s a really useful property as it lets you plan ahead. Perhaps there were a whole lot of possible failure modes that are ruled out (roads washed away, cancelled trains, breakdowns on remote outback highways)?
On the other hand you might just have a bigger variety of journeys in there (e.g. rail, riding, cars, cycling, different routes).
Another thing, on the London-Sydney post – I have the impression there was quite a bit of excitement about faster shipping, but perhaps that was more about the North Atlantic?
Regarding the point about the North Atlantic shipping times – are you referring to the Blue Riband?
I’d agree (from at least a point of late twentieth century onwards hindsight) that this does seem to be a connection between shipping (or at least ships) and speed, but I’m not sure in terms of this blog post that shipping speeds would get magnitudes faster as appears to be the case for air and land travel.
Having said that is the case of faster travel being linked with luxury, the ocean liners, the aeroplane, fast cars? Or at least the perception of luxury (even if it was as nebulous as emigrating via steerage for a chance of a ‘better life’)? If the latter how much was this down to deliberate marketing (and increasingly national/ist pride) on behalf of companies like White Star Lines, Hamburg America line, Norddeutscher Lloyd line, Italia Flotta Riunite, and Compagnie Générale Transatlantique?
I wonder what a similar search for London and New York would produce in terms of raw numbers of data. Or even a general trove search to generate numbers for the term “Blue Riband”? I’d suggest that speed and sea travel were news-worthy, but to get the headlines some form of novelty was required, and unlike air travel shipping had had years and years of travelling so some of the novelty may have had to have been ‘manufactured’.
For the sake of the UK-Australia analysis maybe the lack of international competition, or a publicised equivalent of the Blue Riband has skewed results away from being to show what was actually happening on a wider world-stage?
Alex:
Yes, predictability is useful, and probably often more useful than pure speed (so onward connections can be made, warehouse space booked, that sort of thing). In this period there probably was more reliability at sea in terms of engines, too. But a couple of things about these hota-time plots need to be remembered. 1. a lot of the variance in the “land” (indigo) data points is probably due to the varying modes (comparing travel time by motor car with travel time by horse, for example, probably isn’t very useful). Or at least you’d need to dig in to see what each data point represents. 2. hota-time doesn’t tell us much about typical or practical travel times. Because it’s drawn from newspaper headlines it massively over-represents novelty and hence under-represents regularity (nobody ever wrote headlines about the overnight train from Sydney getting in on time, well, not unless that was an unusual occurrence!). That applies to air timetables as well as sea timetables — these were only newsworthy when they were new and improved.
Alex, Martin:
Yes, the Blue Riband was definitely a thing! You make a good point about shipping companies maybe looking for different kinds of novelty in order to compete in the publicity stakes (Bernhard Rieger has a good chapter on this in Technology and the Culture of Modernity in Britain and Germany, 1890-1945; another way was linking with or investing in aviation itself). It looks like there was some interest in the Blue Riband in Australian newspapers, but not a huge amount (replicating the basic hota-time Trove search for New York-London gives 309 hits before weeding out, peaking in the 1900s).
But we should also remember that Australia wasn’t a sleepy backwater (well, not always) — in the late 19th century it was one of the prime destinations for shipping (think gold and wool, as well as passengers as you mention); Melbourne was one of the busiest ports in the world in the 1850s. In the clipper era captains outdid each other in getting here the fastest. (Geoffrey Blainey discusses this in The Tyranny of Distance; see also Robert Lee, Transport: An Australian History. And none of this really shows up in hota-time (except for nostalgic pieces in the 1930s when this trade was finally dying). As I think I’ve said, I think that’s due to the different way that newspapers reported these stories in the earlier era, but I admit I haven’t nailed it down completely.