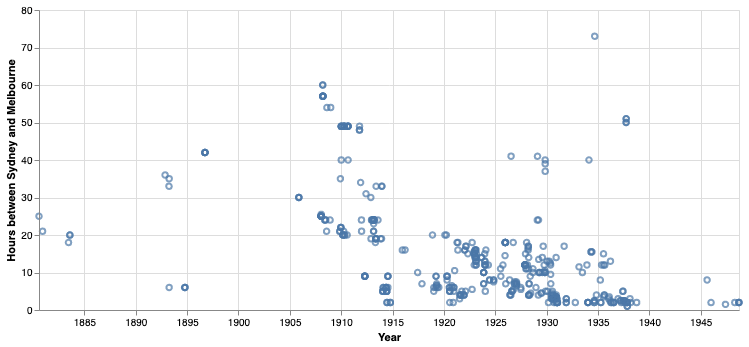
One thing we were curious to try with hota-time is to see whether the idea and the code could be applied beyond looking at London-Sydney travel times. And it can! Here is the output for Melbourne-Sydney travel times, in hours rather than days:
Lots of data points, roughly the same as for the London-Sydney plot. It does look like there is some sort of trend over time, but it's pretty messy. So let's break it down a bit so we can see what's going on.
Nearly four years ago, I wrote a post about a software project Tim Sherratt and I were working on for Heritage of the Air called hota-time. Briefly, the idea was that hota-time would extract and then plot travel times between London and Sydney mentioned in Trove Newspaper headlines, as a quantitative way to gauge the qualitative impact that aviation had on Australian perceptions of distance -- or, to be more precise, travel time. We (Tim) wrote the code, proved the concept to our satisfaction, uploaded the project, and then didn't get around to writing it up for publication. Which we are now remedying… nearly four years later! (The writing, that is, not yet the publication.)
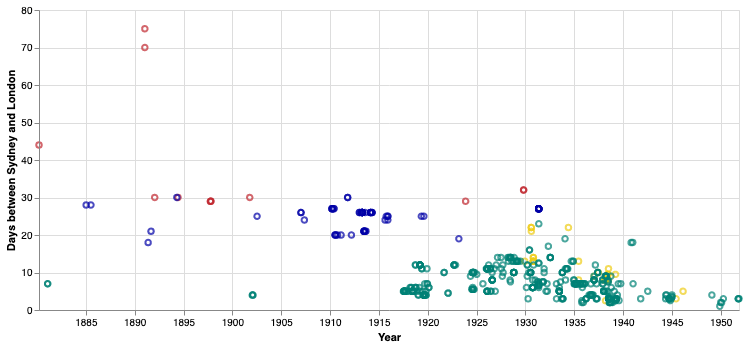
As part of this process, we've been cleaning up the data and trying some different visualisations. Here's one of the more interesting plots.
This is an updated version of the first plot in the old post, but instead of just lumping all the data together, it is separated out by colour:
dark red: sea, present
indigo: sea, future
yellow: air, present
teal: air, future
That is, present travel times are those reported as actually having been achieved, whereas future travel times have not yet been achieved (usually because they are medium or long-term forecasts, but shorter-term schedule changes fall into this category too). So dark red + yellow tracks actual travel times between London and Sydney, while indigo + teal tracks predicted travel times. Or dark red + indigo tracks sea travel, while yellow + teal tracks air travel.
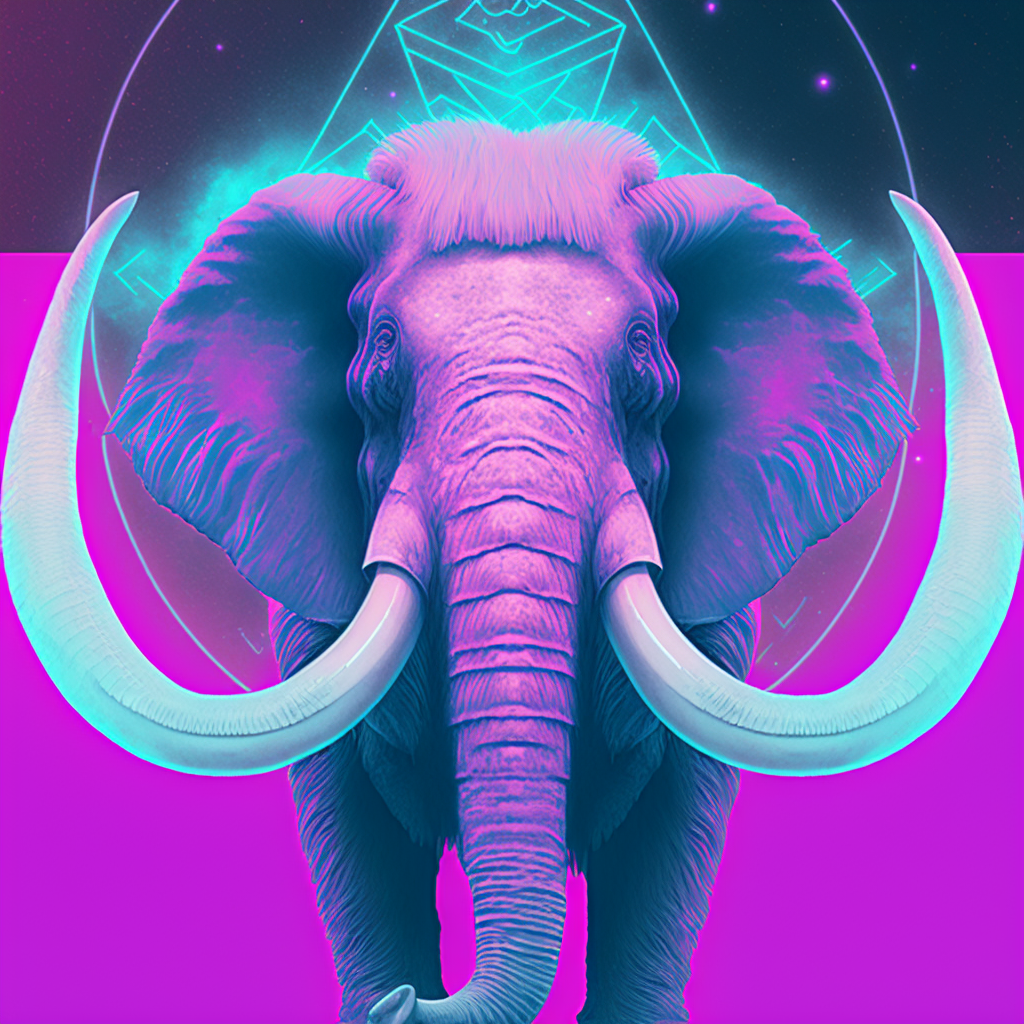
It's time for a new bot! Unlike myTrovebots, this one isn't useful or even historical; it's just for fun. @TTAships tweets out an image of a spaceship (mostly), once(ish) a day.
I have a short, non-peer-reviewed article about Trove bots coming out in History Australia as part of a special issue on Trove; the advanced access version has just been published. Here's the abstract:
Like many other historians I use Trove for both targeted searches and exploratory ones, which in itself has revolutionised my historical research practice. However, I have recently been exploring the potential of Tim Sherratt’s concept of ’Trove bots’ – Twitter bots which tweet links to random Trove Newspaper articles – as, in effect, automated research assistants, as well as public engagement tools. Here, I will discuss how I have been using one such bot, @TroveAirRaidBot, in my current writing project, and its limitations and hopefully its potential.
It was an interesting piece to write: partly trying to make a case for experimenting with Trove bots for their curiosity and engagement value, but more reflecting on how useful their directed serendipity can be for serious research too. Also, it amuses me to have a formal publication with a Twitter handle in the title!
It's currently available for free, but I'm not sure how long that will last. In any case, the green open access version is here.
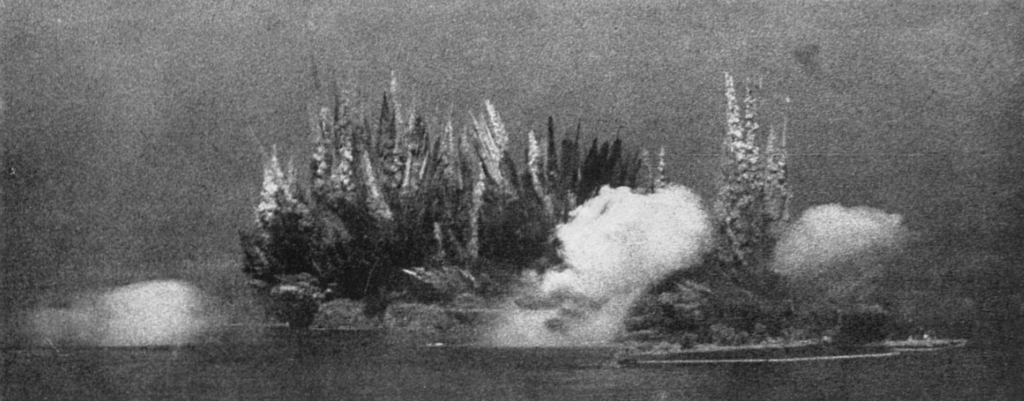
In the previous post I looked at the possible origins of the phrase 'big bang' -- as in 'Big Bang' -- in Operation Big Bang, the partial destruction in 1947 of Heligoland, a German island in the North Sea. I also suggested that there was longer history to the phrase 'big bang', which I'll also dig into here -- partly for its own sake, partly to illustrate how easy it is track a term's popularity over time in the British Newspaper Archive (BNA). And partly because I love the headline above, over 70 years before the other Big Bang was 'photographed' by COBE.
There have been many big bangs. One particularly important one is the 'Big Bang' in which the Universe began, according to current cosmological understanding, approximately 13.8 billion years ago. This was not a bang at all, in the sense of an explosion, because there was nothing to explode into -- rather it was space itself which was expanding, as it has continued to do for 13.8 billion years. Why, then, do we use this evocative but misleading name for what is arguably the most important event to have ever taken place? It was famously coined by cosmologist Fred Hoyle in a BBC Third Programme broadcast on 28 March 1949 to describe the expanding universe concept, then the main competing theory to one he helped develop, the (now-discredited) steady-state (or continuous creation) theory (emphasis added):
We now come to the question of applying the observational tests to earlier theories. These theories were based on the hypothesis that all the matter in the universe was created in one big bang at a particular time in the remote past. It now turns out that in some respect or other all such theories are in conflict with the observational requirements.1
The term 'big bang' stuck -- or it least it did from the 1970s -- and it now stands for the entire cosmological theory of which it is just one part.2
But why did Hoyle choose that particular phrase, 'big bang'? On one level it is simply catchy, evocative and onomatopoeic. Hoyle himself said later that 'I was constantly striving over the radio -- where I had no visual aids, nothing except the spoken word -- for visual images [...] And that seemed to be one way of distinguishing between the steady-state and the explosive big bang'.3
Recently I've been playing around with AI-generated images. This is far less impressive than it may sound: there's a small community on Twitter and elsewhere doing this stuff already, many using scripts and tutorials which mean you don't need any more skill than the ability to log in to Google Colab, type in some keywords and hit execute. The particular AI model I'm using is VQGAN+CLIP. The AI doesn't 'know' anything about anything, to begin with, but (as I understand it) it trains from a huge image dataset drawn from the internet (imagenet_16384 seems to work best for me) and uses the associated text metadata to iteratively generate images which could be described by your keywords. You can also try starting from (or aiming towards) a selected image (which I haven't tried yet). I let them run for 500 iterations which seems to be enough to converge to something stable.
The results are usually almost, but not quite entirely, unlike whatever it is that you have in mind: not so much an uncanny valley as a whole uncanny landscape with uncanny hills, uncanny trees, uncanny streams, and uncanny clouds. (Actually it does very well with clouds.) I've got a thread going on Twitter of mostly aviation-related images; here are some that I find interesting.
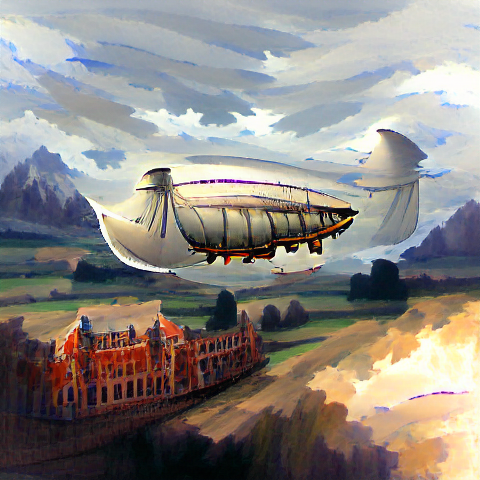
The first prompt I tried was 'a phantom airship'. And it's pretty good! Like any good phantom airship, meaning is in the eye of the beholder, but to me that looks something like an airship floating over an impressionistic grand house with trees, mountains and clouds.
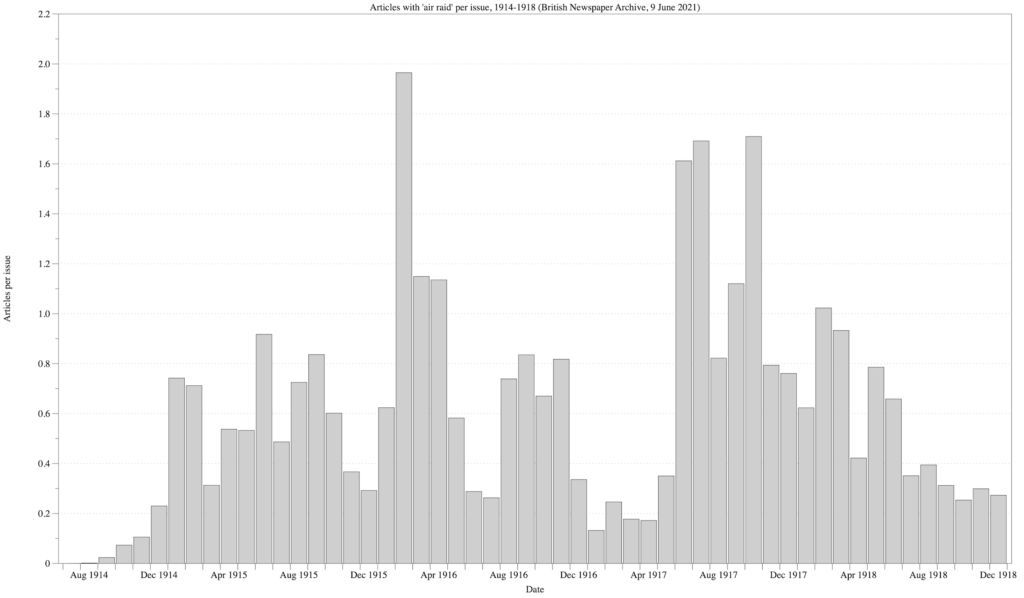
In my previous post I looked at the first appearances of the phrase 'air raid' and related words in the British Newspaper Archive (BNA). Of course, just because these phrases had been coined by somebody, or even used in a newspaper, it doesn't mean they were widely understood -- they might have taken a long time to catch on, or even be reinvented independently. So, in order to get a truer sense of how widespread these phrases were, we need to look at some n-grams.
I recently came across a few more examples from 1920s and 1930s newspapers of the 'Red Baron' being used in reference to Manfred von Richthofen, which I suggested undermined my argument that, in essence, we call him that because of Snoopy. But instead of shrugging my shoulders I decided to get my data on and dig into some numbers. And they confirm my original conclusion: that Richthofen was not called the Red Baron during his lifetime, and it's only from the 1960s on that it became almost impossible to call him anything else. ...continue reading →