[Part of a celebration of Airminded’s 10th anniversary; originally posted on 17 May 2008. I reuse these visualisations of the Blitz and the knock-out blow from the air, especially the second one, all the time — they’re in my book and just this week I showed them in a lecture and a conference paper. So it’s one of Airminded’s more useful posts.]
The talk at Earth Sciences went well, I think. It was a good-sized audience and they seemed interested in what I had to say, judging by the questions afterwards. I also found out that one of the honorary fellows had actually lived in London during the war, and though only a child could remember watching out for V1s passing overhead and even the ‘electric’ atmosphere of the day that war was declared.
I was all set to record the talk, but forgot to fire up the audio app. At some point, I may try recording it again at home or just putting the text up. Until then, here are a couple of the graphs I used, along with some different ways of presenting the same numbers. (Except where indicated, the data is courtesy of Dan Todman, who compiled it from Home Office files. Thanks Dan!)

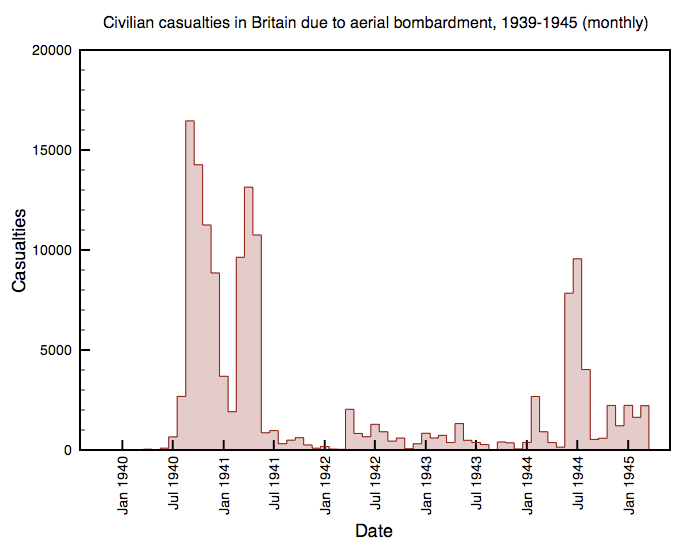
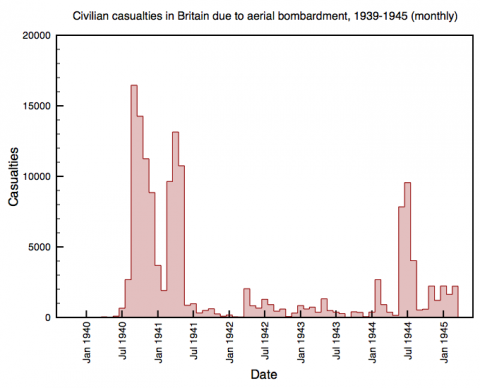
Firstly, this shows the civilian casualties (killed and seriously wounded) each month in Britain due to enemy action between 1939-1945. Most — all? — of these will have the result of bombing, so I’ve labeled it accordingly. (This is the counterpart of a histogram I did for 1914-1918, except that combined civilian and military casualties, and separated different forms of attack.) It’s easy to pick out the Luftwaffe’s major offensives: the biggest peak is September 1940, when the Blitz started; it ended in May 1941, after which casualties were never so high again. There’s a relative lull in January and February 1941, due largely to bad weather conditions. In April-June 1942, there’s the Baedeker Blitz and from January 1944, the Baby Blitz. Then there’s the V-1 offensive in June-September 1944 and the V-2 offensive in September 1944-March 1945.

I thought it might be instructive to compare what actually happened with what was predicted would happen: if the knock-out blow had attempted and if pre-war estimates of German airpower had been correct. I derived this from figures provided by Richard M. Titmuss, Problems of Social Policy (London: H.M.S.O., 1950), 9 and 12-3 10, 13-4, which were estimates made circa 1938 by government bodies for a war starting in 1939. These lead to the following assumptions:
- the Luftwaffe could deliver 3500 tons of bombs on London in the first 24 hours of an attack, and an average of 700 tons per day for some weeks thereafter (Committee of Imperial Defence)
- the casualties caused per ton of bombs dropped would be 48 (24 killed, 24 seriously wounded) (ARP Department, Home Office)
- the war would last for 60 days (CID)
It’s then simple to calculate that a German knock-out blow launched on 3 September 1939 would have led to a bit over 1.1 million casualties in September and a bit over a million in October, 168000 on the first day of war. More than a two million fatalities in just two months.
It’s easy to quibble with these assumptions — for example, I’m using the most pessimistic multiplier for casualties, but that’s partly because it’s easy to relate it to the definition of casualties I’m already using. And my assumption that the 700 tons per day could be kept up for 60 days may well be too high, but I can’t find anything better. The CID did estimate in 1937 that an aerial war of this length would kill 600,000 and wound 1.2 million, so that shows that I’m in the right range and also that officials did make these sorts of calculations at the time.
Anyway, the point of the histogram is to show that the actual bombing, as bad as it was, was nothing like as terrible as ‘the expected holocaust’ (as Tom Harrison termed it), and I think it succeeds — you can just make out the Blitz and the V-1 attacks, but they’re just tiny blips. However, precisely because of the huge disparity in scale, it’s hard to make a meaningful comparison.

In his graphs of all British casualties, Dan opted for running cumulative figures rather than monthly ones, and that is indeed better for showing the overall picture — whereas monthly is better at showing intensity, I think. So, here’s my actual vs. predicted plot redone in cumulative fashion. Even by the end of five and a half years of total war, the scale of the knock-out blow isn’t even approached. (In fact, I think that even when military casualties are taken into account, the knock-out blow still wins handily.)

Here’s a different way to present the monthly data. This time I’ve plotted the casualties on a log scale. This is good for showing changes in the order of magnitude, and it’s immediately apparent that the knock-out blow was around two orders of magnitude (i.e., about 100 times) more intense than the worst month of the Blitz.

Finally, the cumulative casualty figures on a log scale. So, overall, the civilian experience of bombing over the whole of the Second World War (mainly meaning the Blitz) was about one order of magnitude (i.e. about 10 times) less devastating than the knock-out blow predicted shortly before the war.
The knock-out blow would have been 100 times more intense and 10 times more devastating than the Blitz was — I’ll have to remember that!
![]() This work is licensed under a Creative Commons Attribution-NonCommercial-NoDerivatives 4.0 International License.
Permissions beyond the scope of this license may be available at http://airminded.org/copyright/.
This work is licensed under a Creative Commons Attribution-NonCommercial-NoDerivatives 4.0 International License.
Permissions beyond the scope of this license may be available at http://airminded.org/copyright/.


